Server dashboard
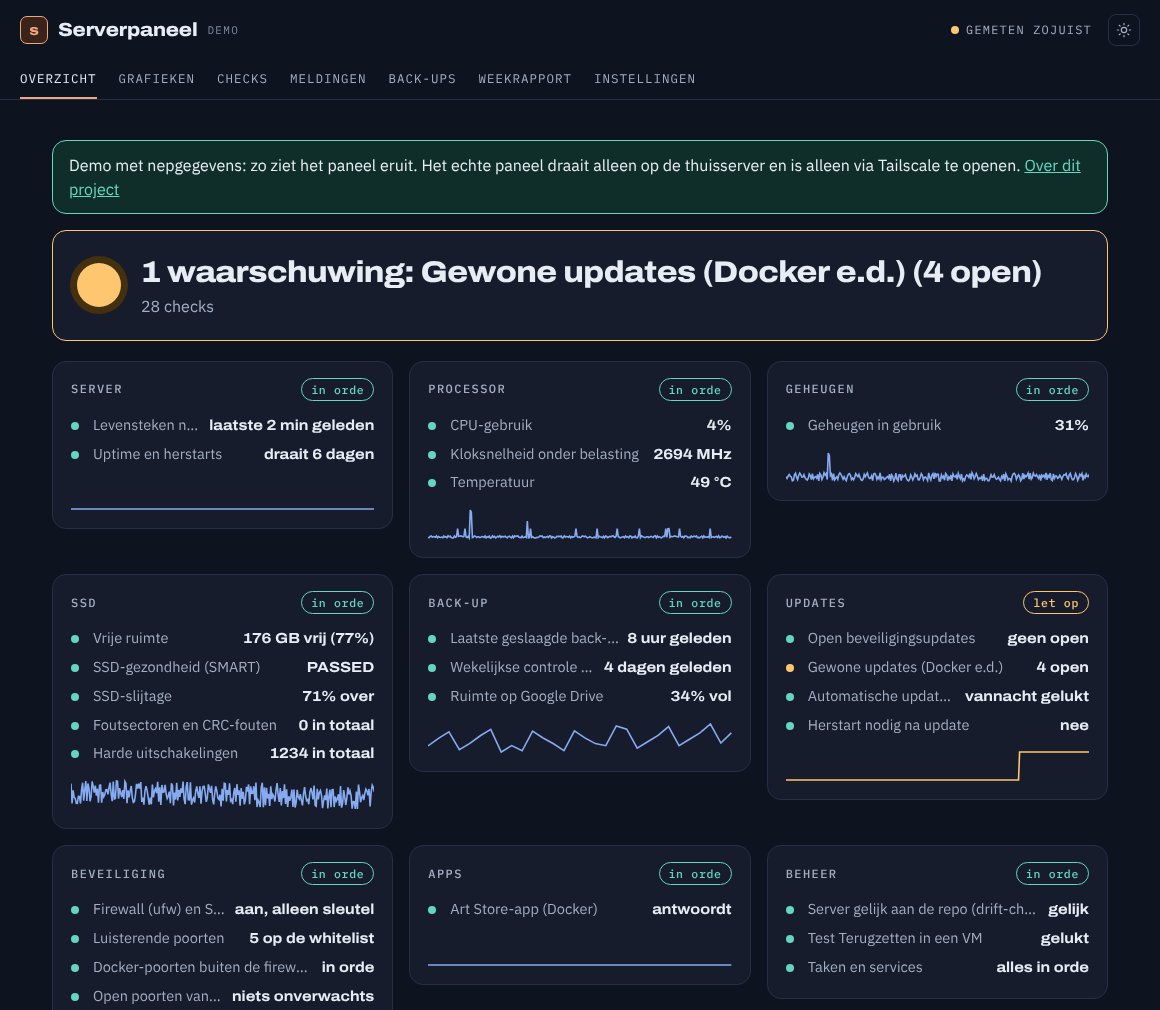
A home-made dashboard for the home server. It checks every minute that everything is fine, keeps the measurements in charts and only sends a push notification when something is really wrong. Built with Claude Code, on the server itself.
Try the demo (in Dutch) →- Checks
- 32
- Measured
- every minute
- Alert channels
- 3
- Cost per month
- € 0
Measure, store, show, alert
Every minute the collector measures how the server is doing and writes it to a small database. The dashboard only reads that database. The notifier watches for a check changing colour and then sends a message. If the whole server goes down, a watchdog on the internet notices that the heartbeats stop.
From plan to dashboard in six steps
Claude wrote the plan, the code and the explanation for every check. I chose what to monitor, the thresholds and how often I want to be disturbed. Every change went to the server's repo as a pull request.
-
1
A plan first
ClaudeReady-made packages like Grafana or Netdata can do a lot, but they are heavy for a laptop from 2013 and do not tell you what to do. Claude wrote a plan for a home-made app: small, read-only, and with every check explaining in plain language what it measures and what you can do.
-
2
One file with thresholds
GitHubAll limits live in one file,
drempels.yaml. Yellow means: look at it soon. Red: act now. Dashboard and alerts read the same file, so they always agree. Changing a threshold goes through a pull request. -
3
Measuring every minute
PythonA timer starts the collector every minute. It measures processor, temperature, memory, SSD, updates, backups, firewall, open ports and apps, and reads what the other jobs on the server have written. Minute readings are kept for 14 days, quarter-hour averages for a year and daily averages forever.
-
4
Alerts that do not nag
ntfyI only hear about it when a check changes colour, not again every minute. Red sends a push notification and an e-mail right away, yellow a summary at 08:00. Between 22:00 and 07:00 only red. Every alert also becomes a GitHub issue, which closes by itself once things are fine again.
-
5
A watchdog outside the house
healthchecks.ioWhen the power fails, the server cannot report anything itself. So every five minutes it sends a heartbeat to healthchecks.io. If that stays away for half an hour, the service sends a push notification and e-mail on its own.
-
6
A weekly report every Sunday
Claude CodeOn Sunday morning Claude reads the week's measurements and writes a few paragraphs on how it went: outages, backups, SSD wear, and whether I need to do anything. Usually the answer is: no.
Rules for the dashboard
- The dashboard can only read. It has no buttons that change anything on the server.
- The dashboard is not on the internet. I only open it through Tailscale, on my phone too.
- Passwords and keys for the alerts live only on the server, never in git.
- Every open port is on a whitelist with an explanation. An unknown port turns yellow or red.
- Claude may not restart the server itself. The dashboard says when it is needed; I choose the moment.
What is inside
| Part | Choice |
|---|---|
| Collector | Python with only the standard library, started by a systemd timer |
| Storage | SQLite: minutes 14 days, quarter hours 1 year, days forever |
| Dashboard | Small Python web server in Docker, home-made SVG charts, scher.nl house style |
| Access | Only through Tailscale, with HTTPS |
| Alerts | ntfy (push), Gmail, GitHub issues |
| Watchdog | healthchecks.io, free plan |
| Report | Claude Code, every Sunday at 09:00 |
Click through the demo
The demo is the same app as on the server, with half a year of made-up measurements. The app is in Dutch. Look under Grafieken (charts) for last week's power cut, open a check for the explanation and what to do, or read the weekly report (Weekrapport). A few checks about the home network are left out of the demo.
Open the demo →Updated 13 November 2026.